For safety experts, feature selection is a crucial step in developing responsible and robust AI systems.
Properly selected features can significantly enhance the safety and fairness of AI models by:
- Reducing bias: Identifying and removing features that may lead to unfair or discriminatory outcomes.
- Improving interpretability: Focusing on the most relevant features makes models more transparent and easier to audit for safety concerns.
- Enhancing robustness: Selecting stable and reliable features can make models more resilient to adversarial attacks and data drift.
Feature selection is a crucial step in building predictive models.
By identifying the most relevant features, you can improve model performance, reduce overfitting, and simplify the model, making it more interpretable.
In this post, we’ll explore various techniques for feature selection, including correlation analysis, univariate feature selection, recursive feature elimination (RFE), and feature importance using machine learning models.
You can find the complete code for the feature selection process in my GitHub repository.

Feature Selection:
The process of selecting the most important variables (features) from the dataset to be used in building a predictive model. It helps in improving model performance, reducing overfitting, and simplifying the model.
Overfitting:
A scenario where a model performs well on the training data but fails to generalize to new, unseen data. This often happens when the model is too complex and captures noise rather than the underlying pattern.
1. Correlation Analysis
Correlation Analysis:
A statistical method used to evaluate the strength and direction of the linear relationship between two numerical variables. A correlation coefficient closer to 1 or -1 indicates a strong relationship.
The first step in feature selection is to examine the correlation between features and the target variable (SalePrice). Features with a high correlation to the target are typically more useful for the model.
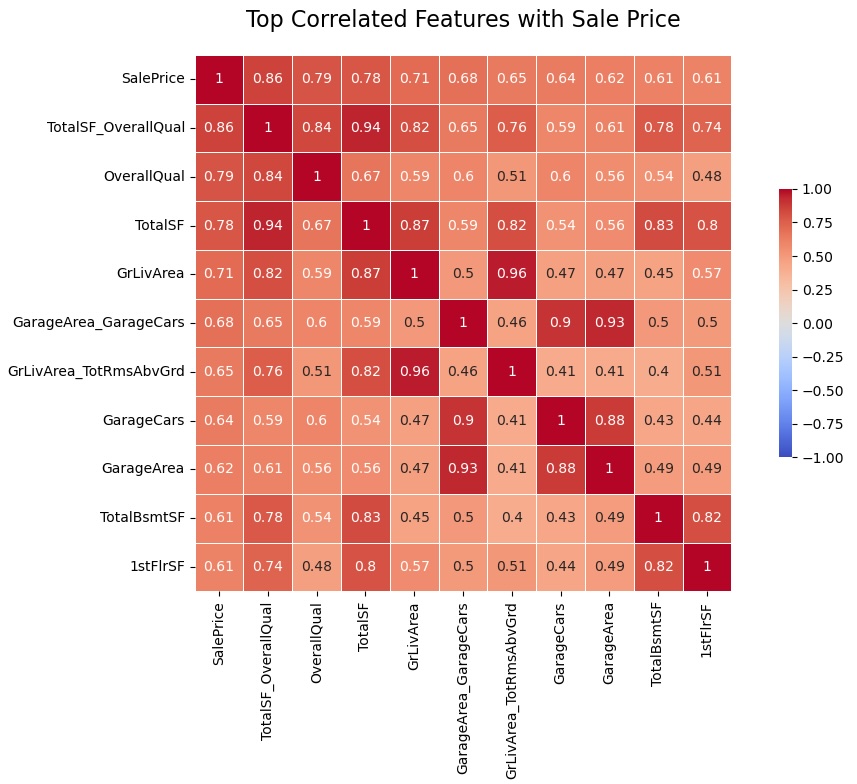
The above heatmap displays the correlation coefficients between the top 10 features most correlated with “SalePrice”.
- TotalSF_OverallQual: This is an interaction feature I created, combining total square footage with overall quality. Its high correlation suggests that the combination of size and quality is a very strong predictor of house price.
- OverallQual: The overall quality rating of the house is the second most correlated feature, indicating that higher quality homes tend to have higher prices.
- TotalSF: Total square footage is highly correlated with price: larger homes tend to be more expensive.
- GrLivArea: Above ground living area is also strongly correlated with price.
- GarageArea_GarageCars: This is an interaction feature, combining garage area with the number of cars it can hold. Its high correlation suggests that larger garages that can accommodate more cars are associated with higher house prices.
- GrLivArea_TotRmsAbvGrd: This interaction feature combines above ground living area with the total rooms above ground. Its correlation suggests that houses with more and larger rooms above ground tend to be more expensive.
- GarageCars: The number of cars a garage can hold is correlated with price, likely because it’s an indicator of garage size and possibly overall house size.
- GarageArea: Similar to GarageCars, the area of the garage is correlated with price.
- TotalBsmtSF: The total square footage of the basement is correlated with price, indicating that houses with larger basements tend to be more expensive.
- 1stFlrSF: The square footage of the first floor is also correlated with price.
2. Univariate Feature Selection
Univariate Feature Selection:
A method that evaluates each feature individually to determine its statistical relationship with the target variable, selecting the best ones based on a scoring function.
Univariate feature selection is a powerful technique that evaluates each feature individually to determine its relationship with the target variable.
By assessing features independently, we can identify those that have the strongest statistical relationship with the target, which can be crucial for building a more efficient and accurate predictive model.
In this analysis, I used the SelectKBest method from scikit-learn, coupled with the f_regression score function, which is specifically designed for regression problems.
The f_regression function evaluates the linear relationship between each feature and the target variable by performing an F-test, which compares the variance explained by the feature to the variance that remains unexplained. The higher the F-statistic, the stronger the linear relationship between the feature and the target.
I selected the top 10 features that have the highest F-statistics. These features are most strongly correlated with SalePrice and are expected to have a significant impact on the predictive performance of the model.
Results:
The top 10 features selected by univariate feature selection are as follows:
- OverallQual: A direct measure of the overall material and finish quality of the house, consistently a top predictor of house prices.
- TotalBsmtSF: The total square footage of the basement, indicating that larger basements contribute significantly to the overall value of a house.
- GrLivArea: Above ground living area, which is another critical factor in determining a house’s market value.
- GarageCars: The number of cars that the garage can accommodate, reflecting the importance of garage space in the valuation.
- TotalSF: The total square footage of the house, combining basement, first, and second floors, which is a comprehensive measure of the home’s size.
- TotalBathrooms: The sum of all bathroom-related features, showing that the number of bathrooms is a key determinant of house price.
- TotalSF_OverallQual: An interaction feature combining total square footage with overall quality, emphasizing the compounded effect of size and quality on price.
- GrLivArea_TotRmsAbvGrd: This interaction feature combines the above-ground living area with the total number of rooms above ground, highlighting how larger and more spacious homes tend to be more valuable.
- GarageArea_GarageCars: Another interaction feature, combining garage area with the number of cars the garage can hold, indicating that both the size and capacity of the garage are important for house pricing.
- TotalSF_OverallCond: An interaction between total square footage and overall condition, showing how the size of the house combined with its condition influences the overall value.
Discussion:
The features selected through this method align well with what we might intuitively expect to influence house prices. Features like OverallQual, TotalSF, and GrLivArea are straightforward indicators of a home’s quality, size, and livable space—all critical factors in real estate valuation.
The inclusion of interaction features, such as TotalSF_OverallQual and GrLivArea_TotRmsAbvGrd, highlights the importance of considering how different aspects of a house interact with each other to affect its market value. For instance, a large house with high-quality finishes is likely to command a higher price than a smaller or lower-quality one, even if they both have the same overall square footage.
By selecting these top 10 features, the model is likely to be more efficient, focusing on the most impactful variables and potentially improving both the accuracy and interpretability of the predictions.
This step of univariate feature selection is crucial in reducing the dimensionality of the dataset, ensuring that the model is not overwhelmed by irrelevant or redundant features, and ultimately enhancing its performance.
3. Recursive Feature Elimination (RFE)
Recursive Feature Elimination (RFE):
A feature selection technique that recursively removes the least important features based on model coefficients, until the desired number of features is reached.
Recursive Feature Elimination (RFE) is a feature selection method that works by recursively removing the least important features based on the model’s coefficients until the desired number of features is reached.
RFE was used with a linear regression estimator to select the top 10 features that contribute most to predicting house prices.
Results:
The top 10 features selected by RFE are as follows:
- Condition2_PosN: This feature represents a specific condition in the dataset, potentially indicating proximity to something positive in the neighborhood, although its exact nature would depend on the dataset’s coding.
- RoofMatl_CompShg: This feature indicates whether the roof material is composite shingles, which is a common and durable roofing material.
- RoofMatl_Membran: Indicates whether the roof material is membrane, often used in flat or low-slope roofs.
- RoofMatl_Metal: Indicates whether the roof material is metal, known for its durability and energy efficiency.
- RoofMatl_Roll: Indicates whether the roof material is rolled, typically a less expensive and less durable option often used for utility buildings or sheds.
- RoofMatl_Tar&Grv: Indicates whether the roof material is tar and gravel, another material used for flat or low-slope roofs, known for being inexpensive but heavy and requiring maintenance.
- RoofMatl_WdShake: Indicates whether the roof material is wood shake, a traditional roofing material that is aesthetically pleasing but requires maintenance.
- RoofMatl_WdShngl: Indicates whether the roof material is wood shingles, similar to wood shake but typically thinner and more uniform.
- PoolQC_Fa: This feature indicates whether the pool quality is rated as “Fair,” suggesting that the presence of a pool, even of fair quality, might influence house pricing.
- PoolQC_missing: This feature is likely a flag for missing values in the pool quality category, treated as a distinct category, indicating that homes without a pool (or where the pool quality data is missing) might be evaluated differently.
Discussion:
The results from RFE are somewhat surprising compared to univariate analysis. The features selected are predominantly related to roof material and pool quality, which suggests that these attributes might have a significant influence on the linear regression model used in RFE, but not necessarily in an intuitive way.
- Roof Material Focus: The heavy emphasis on roof material indicates that in this linear regression model, these specific materials had coefficients that, when combined, significantly affected the prediction. However, the prominence of so many roof materials might not align with common expectations of what drives house prices, such as overall quality, size, or location. This might suggest that the linear regression model found some linear separability with these features, which might not generalize well outside of the training data.
- Pool Quality: The inclusion of
PoolQC_FaandPoolQC_missingalso highlights the influence of pool quality on the model’s decision-making process. The “Fair” quality rating and the missing pool quality flag suggest that even lower-quality pools or the absence of a pool can have a noticeable impact on house prices according to the linear regression model. - Potential Overfitting: The selection of these specific features could also indicate potential overfitting by the RFE process. These features do not make intuitive sense.
- Limitations of Linear Models: The results might also reflect the limitations of using a linear regression model for feature selection. Linear models can sometimes overly emphasize features that have a certain linear relationship with the target, even if those features are not necessarily the most important when considering the data as a whole.
Conclusion:
While RFE is a powerful tool for feature selection, the results in this case suggest that the selected features, dominated by roof material types and pool quality indicators, may not align with intuitive or domain-driven expectations of what influences house prices.
These results might point to specific patterns in the training data that the linear model capitalized on, but they could also signal potential overfitting or model bias. Further analysis or cross-validation would be needed to determine whether these features truly add predictive value or if a different feature selection method might yield more robust and interpretable results.
4. Feature Importance using Machine Learning Models
Feature Importance:
A score given to each feature in the dataset, indicating how much it contributes to the model’s predictions. This is often derived from machine learning models like Random Forest or Gradient Boosting.
Many machine learning models provide built-in feature importance scores. These scores indicate how much each feature contributes to the predictions made by the model. Two popular models for this purpose are Random Forests and Gradient Boosting Machines.
Random Forest Feature Importance
Random Forest is an ensemble method that builds multiple decision trees and averages their predictions to improve accuracy and reduce overfitting. The feature importance in Random Forest is typically determined by how much each feature reduces the impurity (e.g., Gini impurity or entropy) in the trees.
Results
| Feature | Importance |
| TotalSF_OverallQual | 0.808 |
| TotalSF_OverallCond | 0.017 |
| YearBuilt_YearRemodAdd | 0.010 |
| LotArea | 0.009 |
| BsmtFinSF1 | 0.008 |
| BsmtUnfSF | 0.008 |
| OpenPorchSF | 0.007 |
| GarageArea_GarageCars | 0.006 |
| HouseAge_OverallQual | 0.006 |
| TotalBathrooms | 0.005 |
TotalSF_OverallQual (0.808): This interaction feature, combining the total square footage of the house with the overall quality rating, is overwhelmingly the most important feature in the Random Forest model. The high importance score suggests that the combination of size and quality is a dominant factor in predicting house prices, far outpacing other features.
TotalSF_OverallCond (0.017): This feature combines total square footage with the overall condition of the house. Although much less important than TotalSF_OverallQual, it still plays a significant role in the model, indicating that the condition of the house, alongside its size, has a noticeable impact on price.
YearBuilt_YearRemodAdd (0.010): The interaction between the year the house was built and the year it was last remodeled reflects how the age and modernization of a home affect its value.
Gradient Boosting Feature Importance
XGBoost is a gradient boosting framework that builds models sequentially, with each new model correcting the errors made by the previous ones. Feature importance in XGBoost is typically determined by how much each feature contributes to reducing the error in the model during training.
Results
| Feature | Importance |
| TotalSF_OverallQual | 0.432 |
| KitchenQual_TA | 0.071 |
| Alley_missing | 0.054 |
| Neighborhood_Blueste | 0.030 |
| GarageQual_TA | 0.028 |
| LandSlope_Mod | 0.027 |
| MSZoning_RM | 0.019 |
| GarageCars | 0.018 |
| KitchenAbvGr | 0.016 |
| SaleType_New | 0.015 |
TotalSF_OverallQual (0.432): Similar to the Random Forest results, this feature is the most important in the XGBoost model, though its importance score is lower than in the Random Forest, suggesting that while it’s crucial, other features also play a more balanced role.
KitchenQual_TA (0.071): This feature reflects the quality of the kitchen, with “TA” representing “Typical/Average.” Its high importance suggests that kitchen quality is a significant driver of house prices in the XGBoost model, which might be capturing a specific buyer preference for average kitchens over extremes.
Alley_missing (0.054): The presence of missing data in the Alley feature (likely indicating no alley) is an interesting inclusion. This suggests that whether or not a house has access to an alley is a notable factor in the property’s valuation.
Neighborhood_Blueste (0.030): The Neighborhood feature, particularly the Blueste neighborhood, appears important in XGBoost, highlighting the role of location-specific factors in determining house prices.
GarageQual_TA (0.028): Similar to kitchen quality, the typical/average quality of the garage is also important, indicating that buyers value a functional and reasonably well-maintained garage.
Conclusion
Feature selection is a pivotal process in building predictive models, enabling us to enhance model performance, reduce overfitting, and improve interpretability by focusing on the most relevant features.
Through the application of various techniques, we gain a comprehensive understanding of which features most strongly influence house prices.
The results reveal that interaction features, especially those combining total square footage with quality, consistently rank as the most important across different models.
However, the divergence in selected features between methods like RFE and tree-based models highlights the importance of considering multiple approaches to feature selection.
While RFE’s focus on roof materials and pool quality may indicate potential model-specific quirks or overfitting, Random Forest and XGBoost emphasize broader aspects such as overall quality, kitchen attributes, and location, offering a more balanced perspective.
Ultimately, feature selection is not a one-size-fits-all process.
The context of the dataset and the specific modeling approach should guide the choice of features. By carefully selecting and validating these features, we ensure that our models are both robust and interpretable, leading to more accurate predictions and valuable insights in the housing market.